Who owns a car in New York City?
Published:
TL;DR: Most New Yorkers do not own cars, much less drive to work. And the households that do own cars earn a significantly higher income than the ones that don’t. Making it easier to drive, at the expense of transit improvements, does not help the vast majority of New Yorkers and especially not the least affluent.
With vehicle traffic on New York roads back to pre-pandemic levels and upon seeing unsubstantiated claims swirling about who uses cars, I decided to find data about car ownership in New York City.
The most granular and latest available data is from American Community Survey (ACS) 2014-2019. The highest granularity of data released by the Census Bureau is by Census tracts, which are small, typically unchanging geographical regions that contain between 1200 and 8000 people. While individual-level data would have been preferable, data from Census tracts are still indicative of individual-level outcomes.
The majority of New Yorkers do not own a car
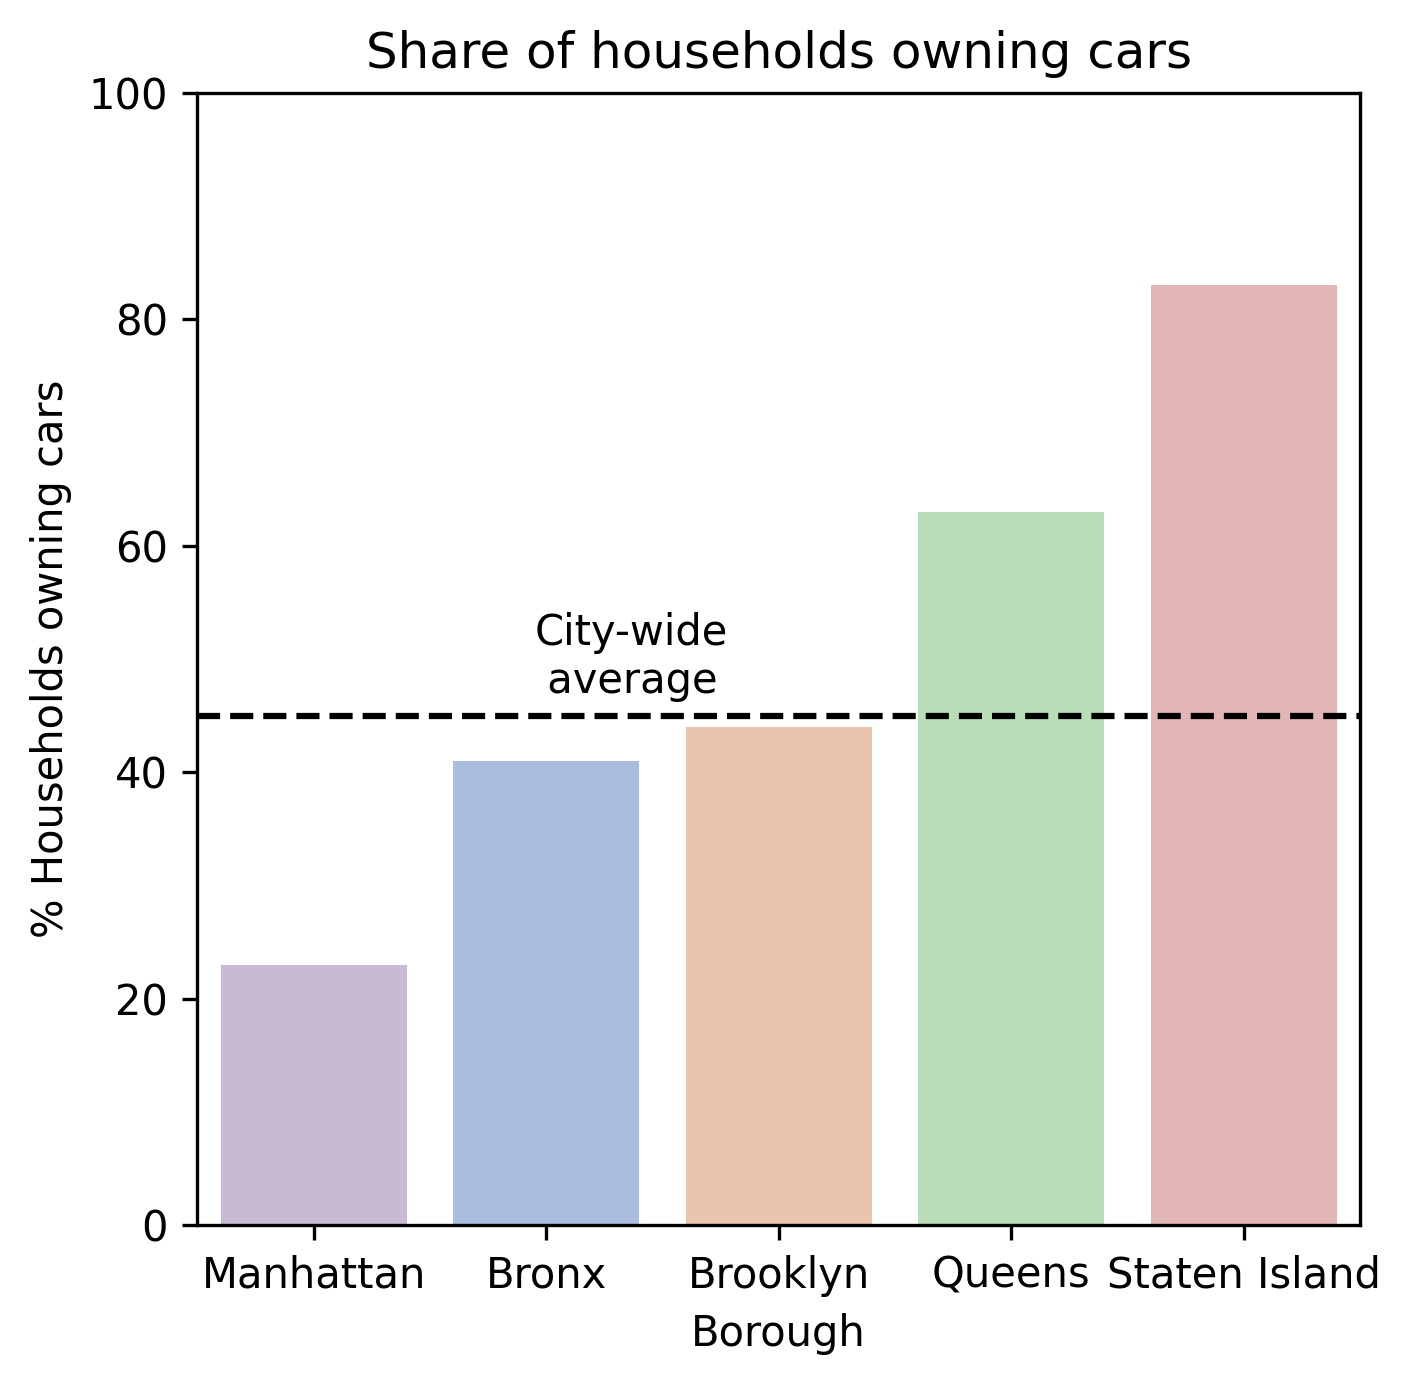
Across the five boroughs, 55% of households do not own a car and only 22% of people commute to work by driving alone in a car while 66% commute by public transit or walking. The plots below show this data broken down by borough along with the corresponding city-wide statistic.
The large majority share of those commuting by transit or walking is not a statistical artifact – it is the norm in every borough except Staten Island. This might not surprise anyone who has lived in New York City, but it is useful to see the data.
![]()
To get a granular view of the data, I visualize car ownership, and other tract-level statistics, on a map of New York City overlayed with subway lines:
From the above map, it is evident that the residents of East Bronx, South Brooklyn, Eastern Queens, Most of Staten Island, and Upper East Side have an above-average share of car ownership, compared to the city or their borough. While some of these neighborhoods are transit deserts, others most certainly are not (hi, Upper East Side!). This leads to the next question:
What factors explain car ownership?
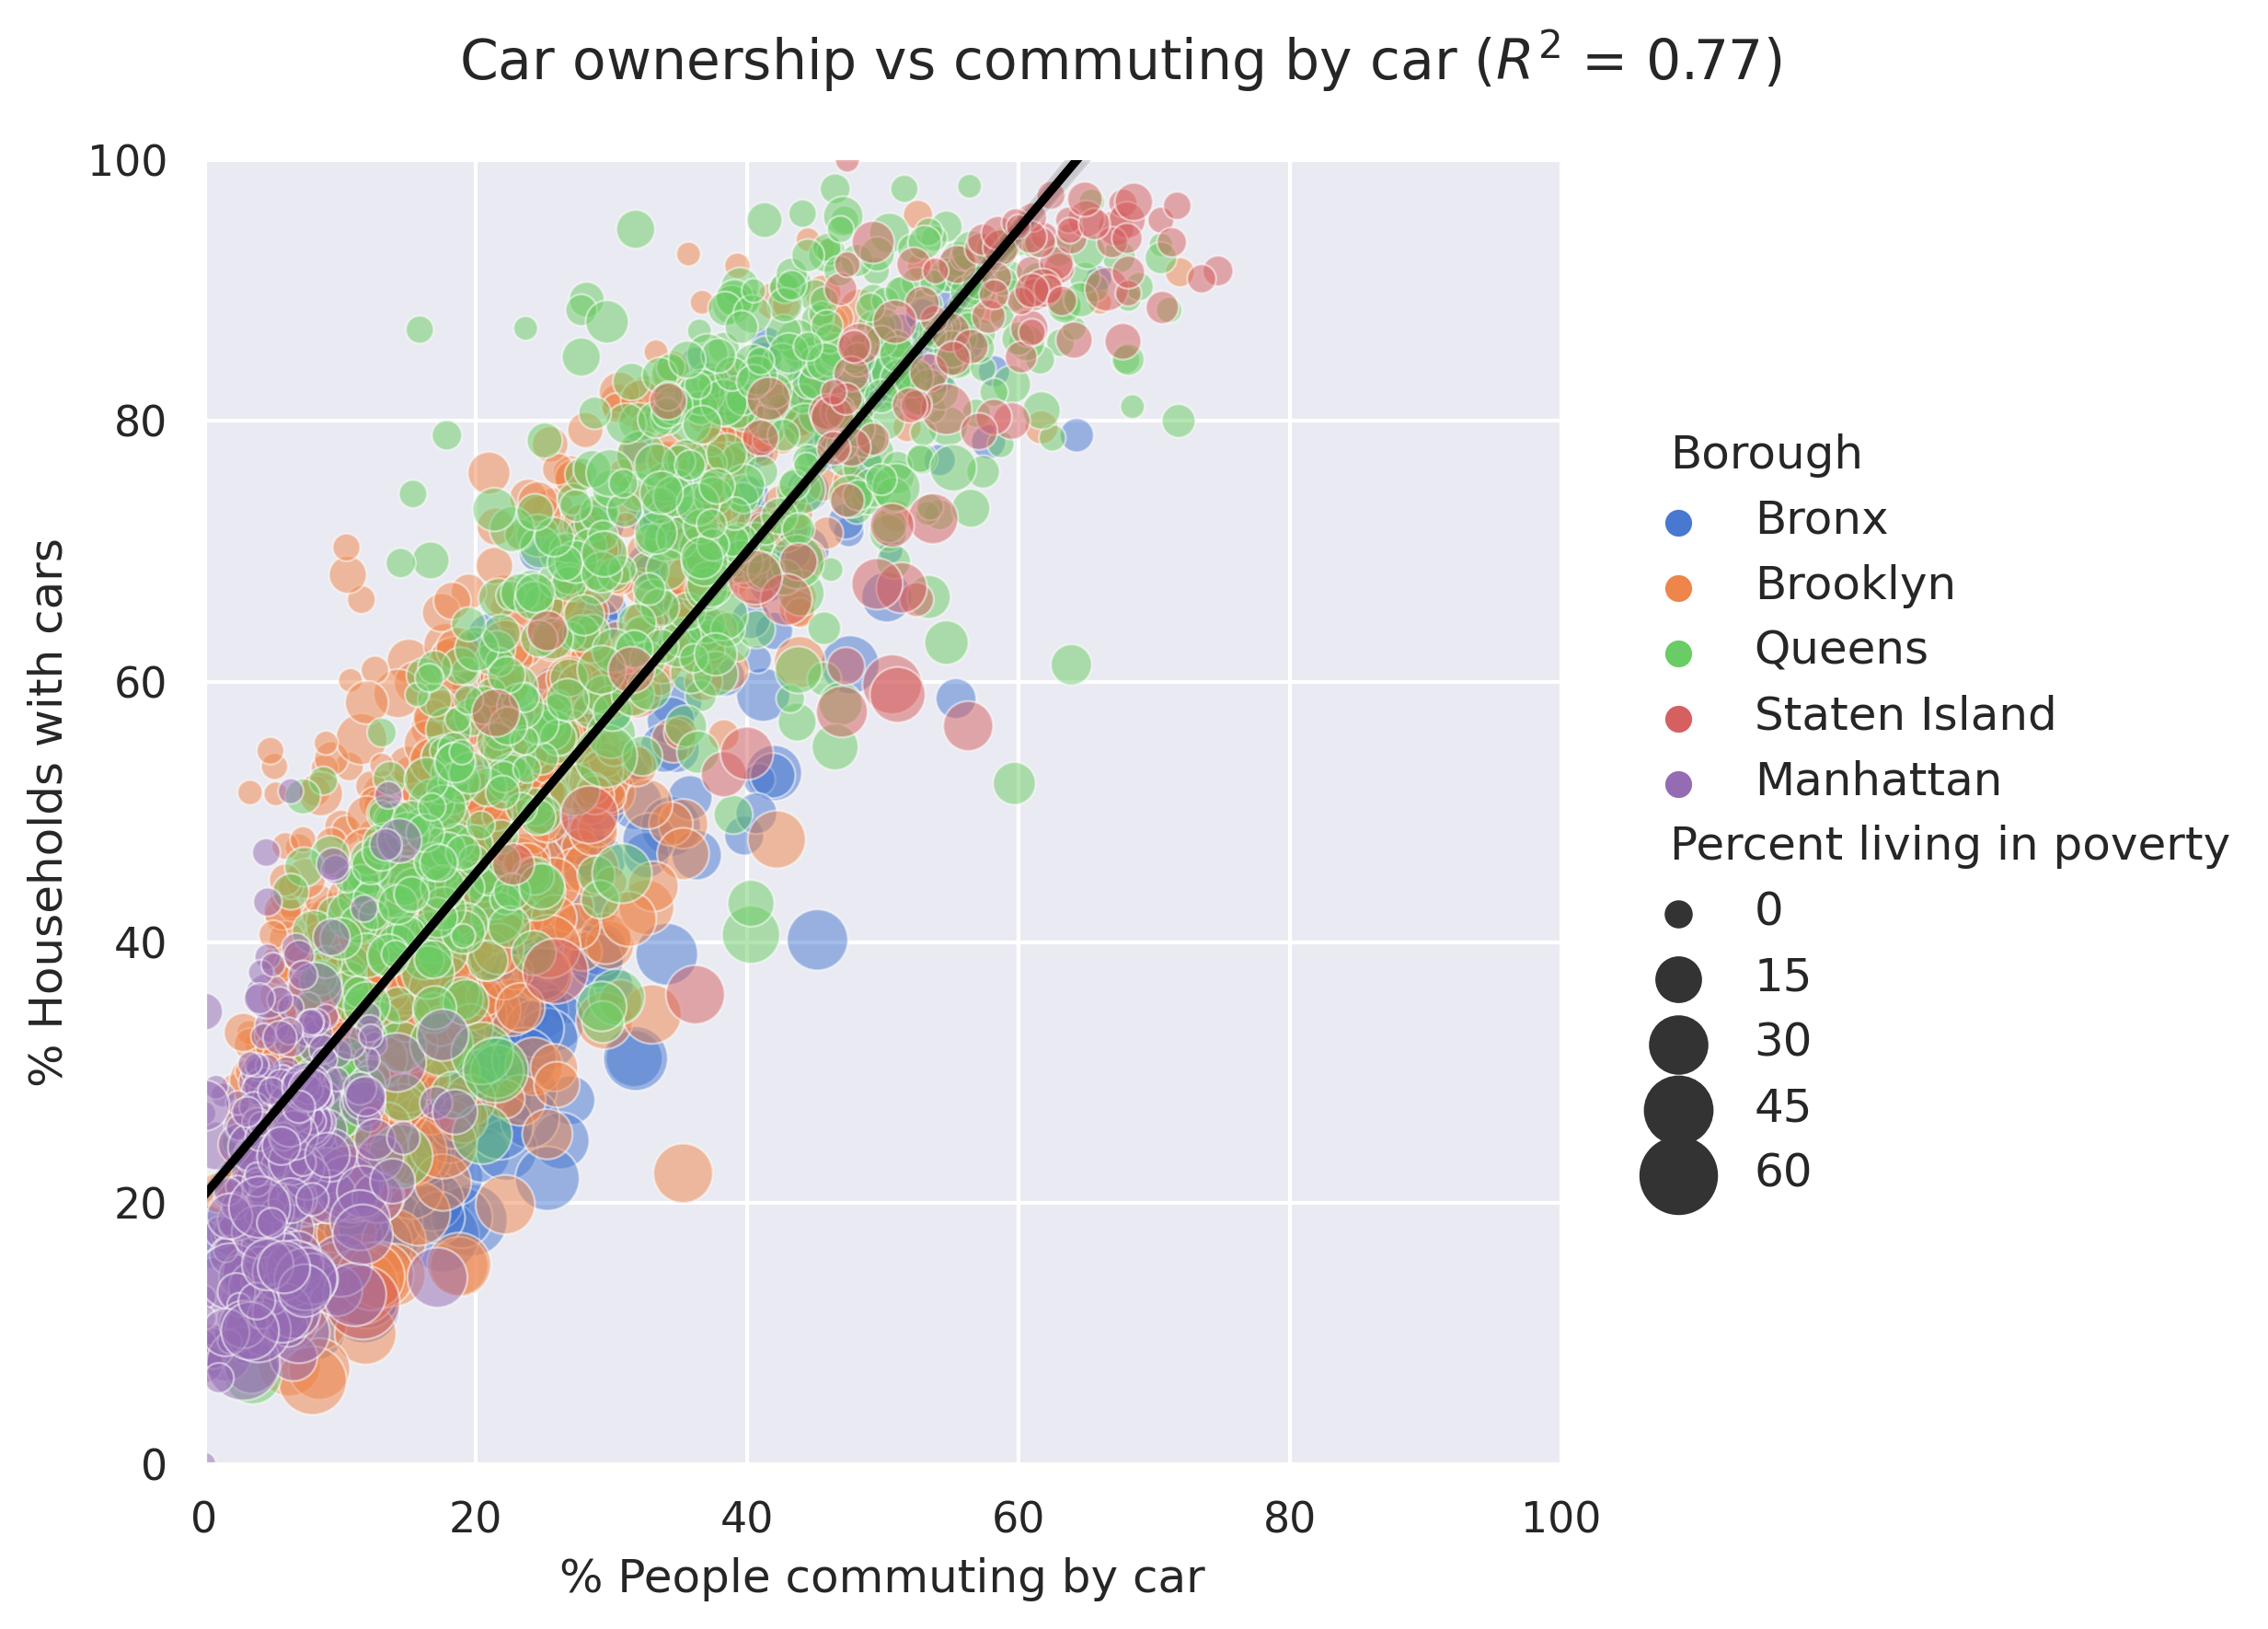
Perhaps unsurprisingly, the percentage of workers driving to work is the single best predictor of car ownership explaining 77% of the variance (R2). Do people own a car because they need it for work? Or do they commute by car to work because they own one? It’s likely the former but even in neighborhoods with 60% car ownership, only 32% of workers on average drive to work.
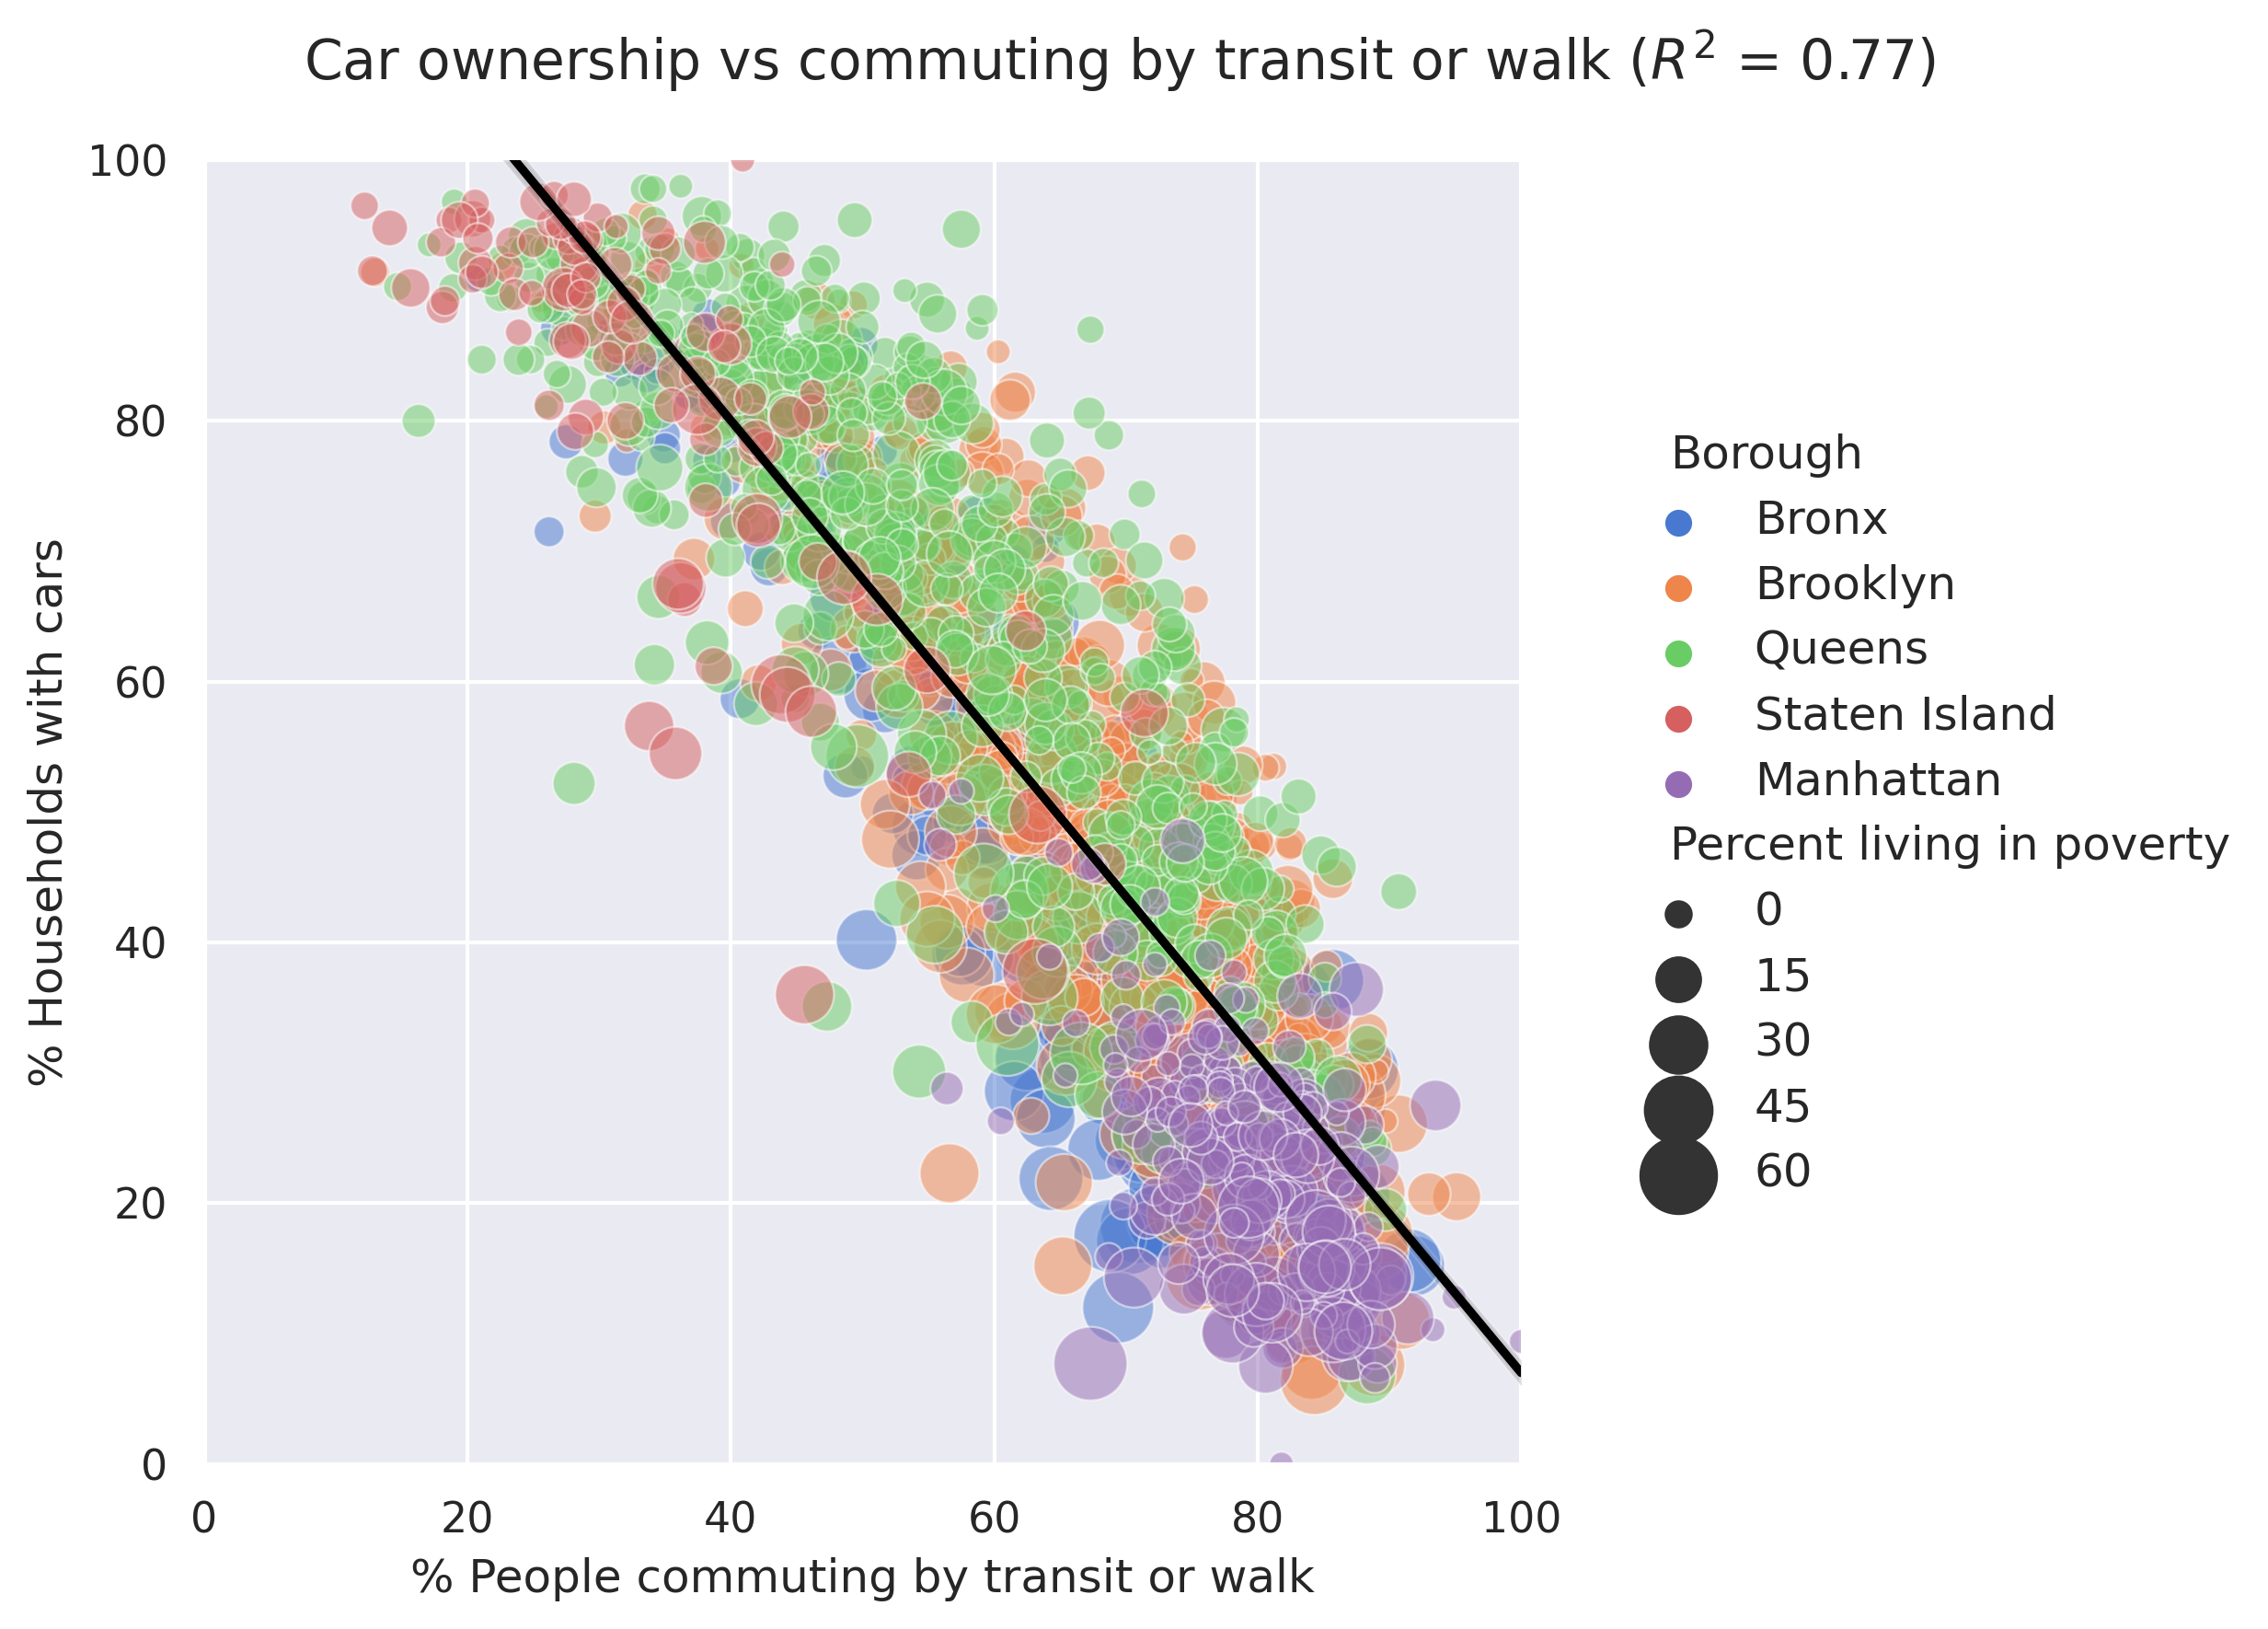
The percentage of workers commuting by walking or public transit is negatively correlated with car ownership and explains the same amount of variance as the percentage of workers driving to work. While this does not prove causation, increased access to public transit in a neighborhood is strongly linked with a reduced need for cars.
No other single variable is as good at predicting car ownership: median household income barely explains any of the variance in car ownership (R2 = 0.06; positively correlated), average household size is a modest predictor (R2 = 0.19; positively correlated), and poverty rate is a slightly better predictor (R2 = 0.23; negatively correlated).
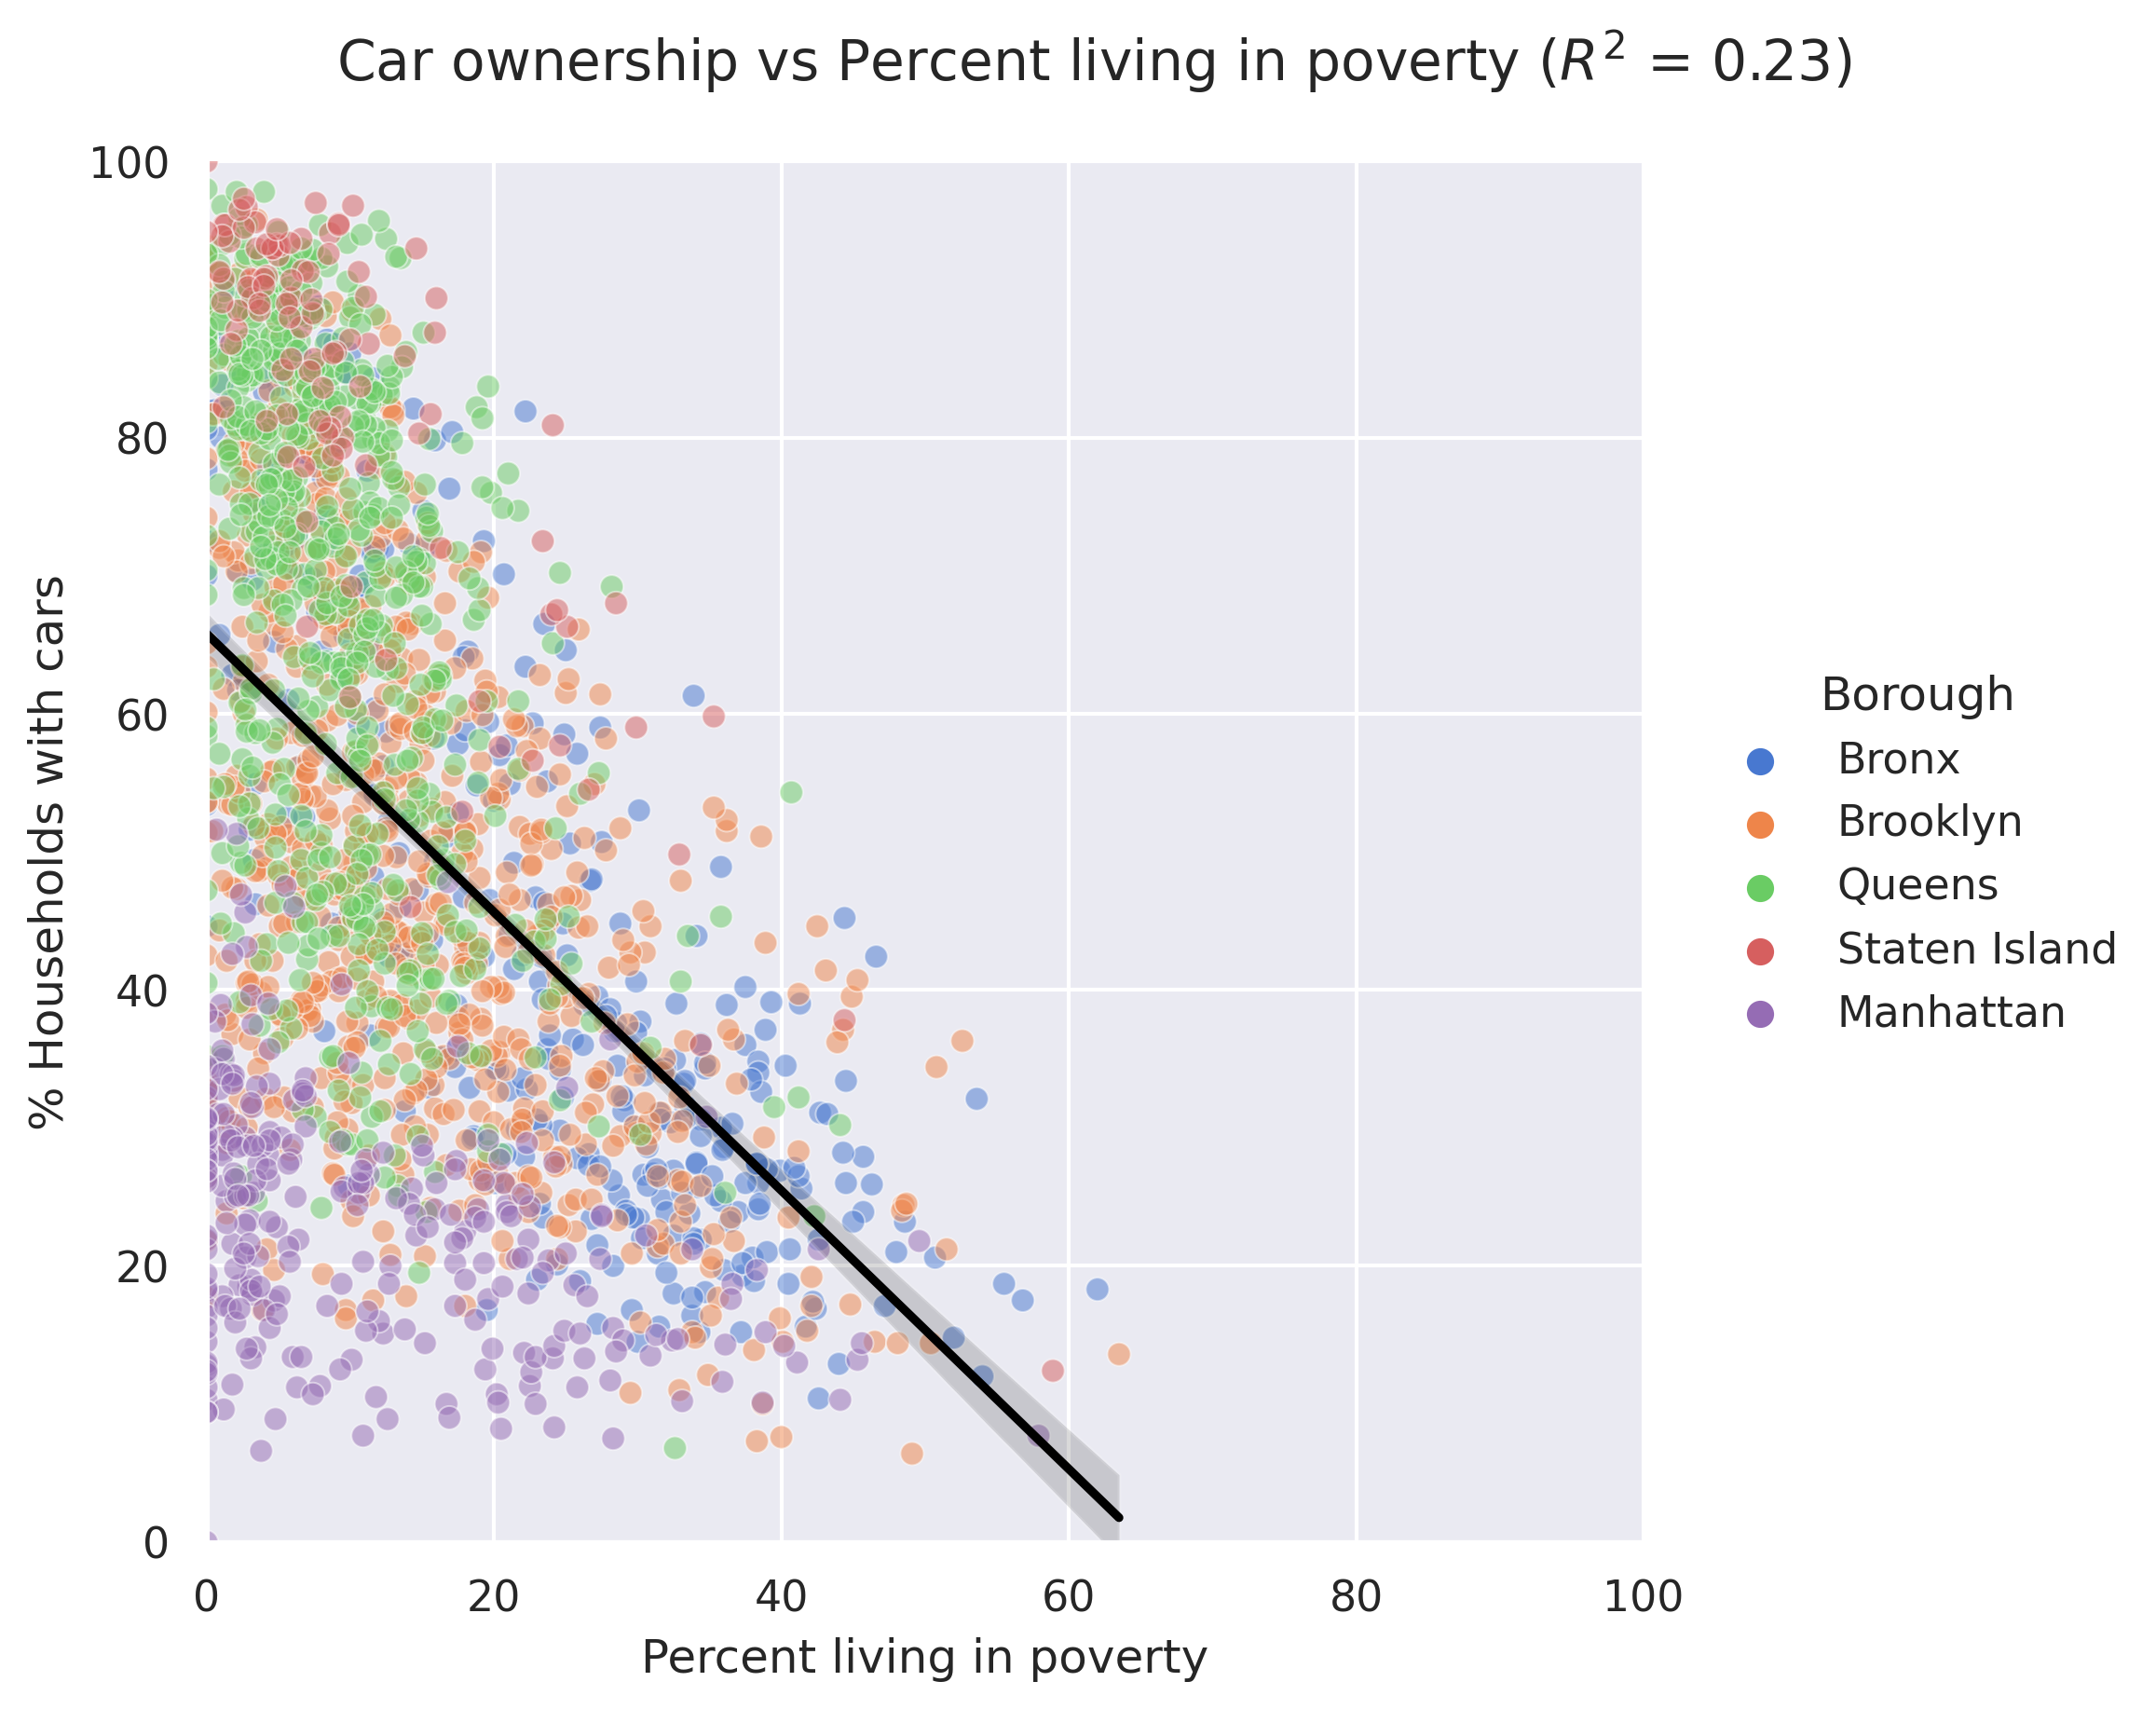
The plots and regression results above show that across neighborhoods with a similar fraction of transit/walk commuters, neighborhoods with a higher rate of poverty have a lower rate of car ownership. Using all four variables: share of commute by public transit, the share of commute by walking, poverty rate, average household size, explain 87% of the variance in car ownership.
When controlled for the rate of poverty and household size, a 10% increase in public transit use in a neighborhood is associated with a 9% drop in car ownership.
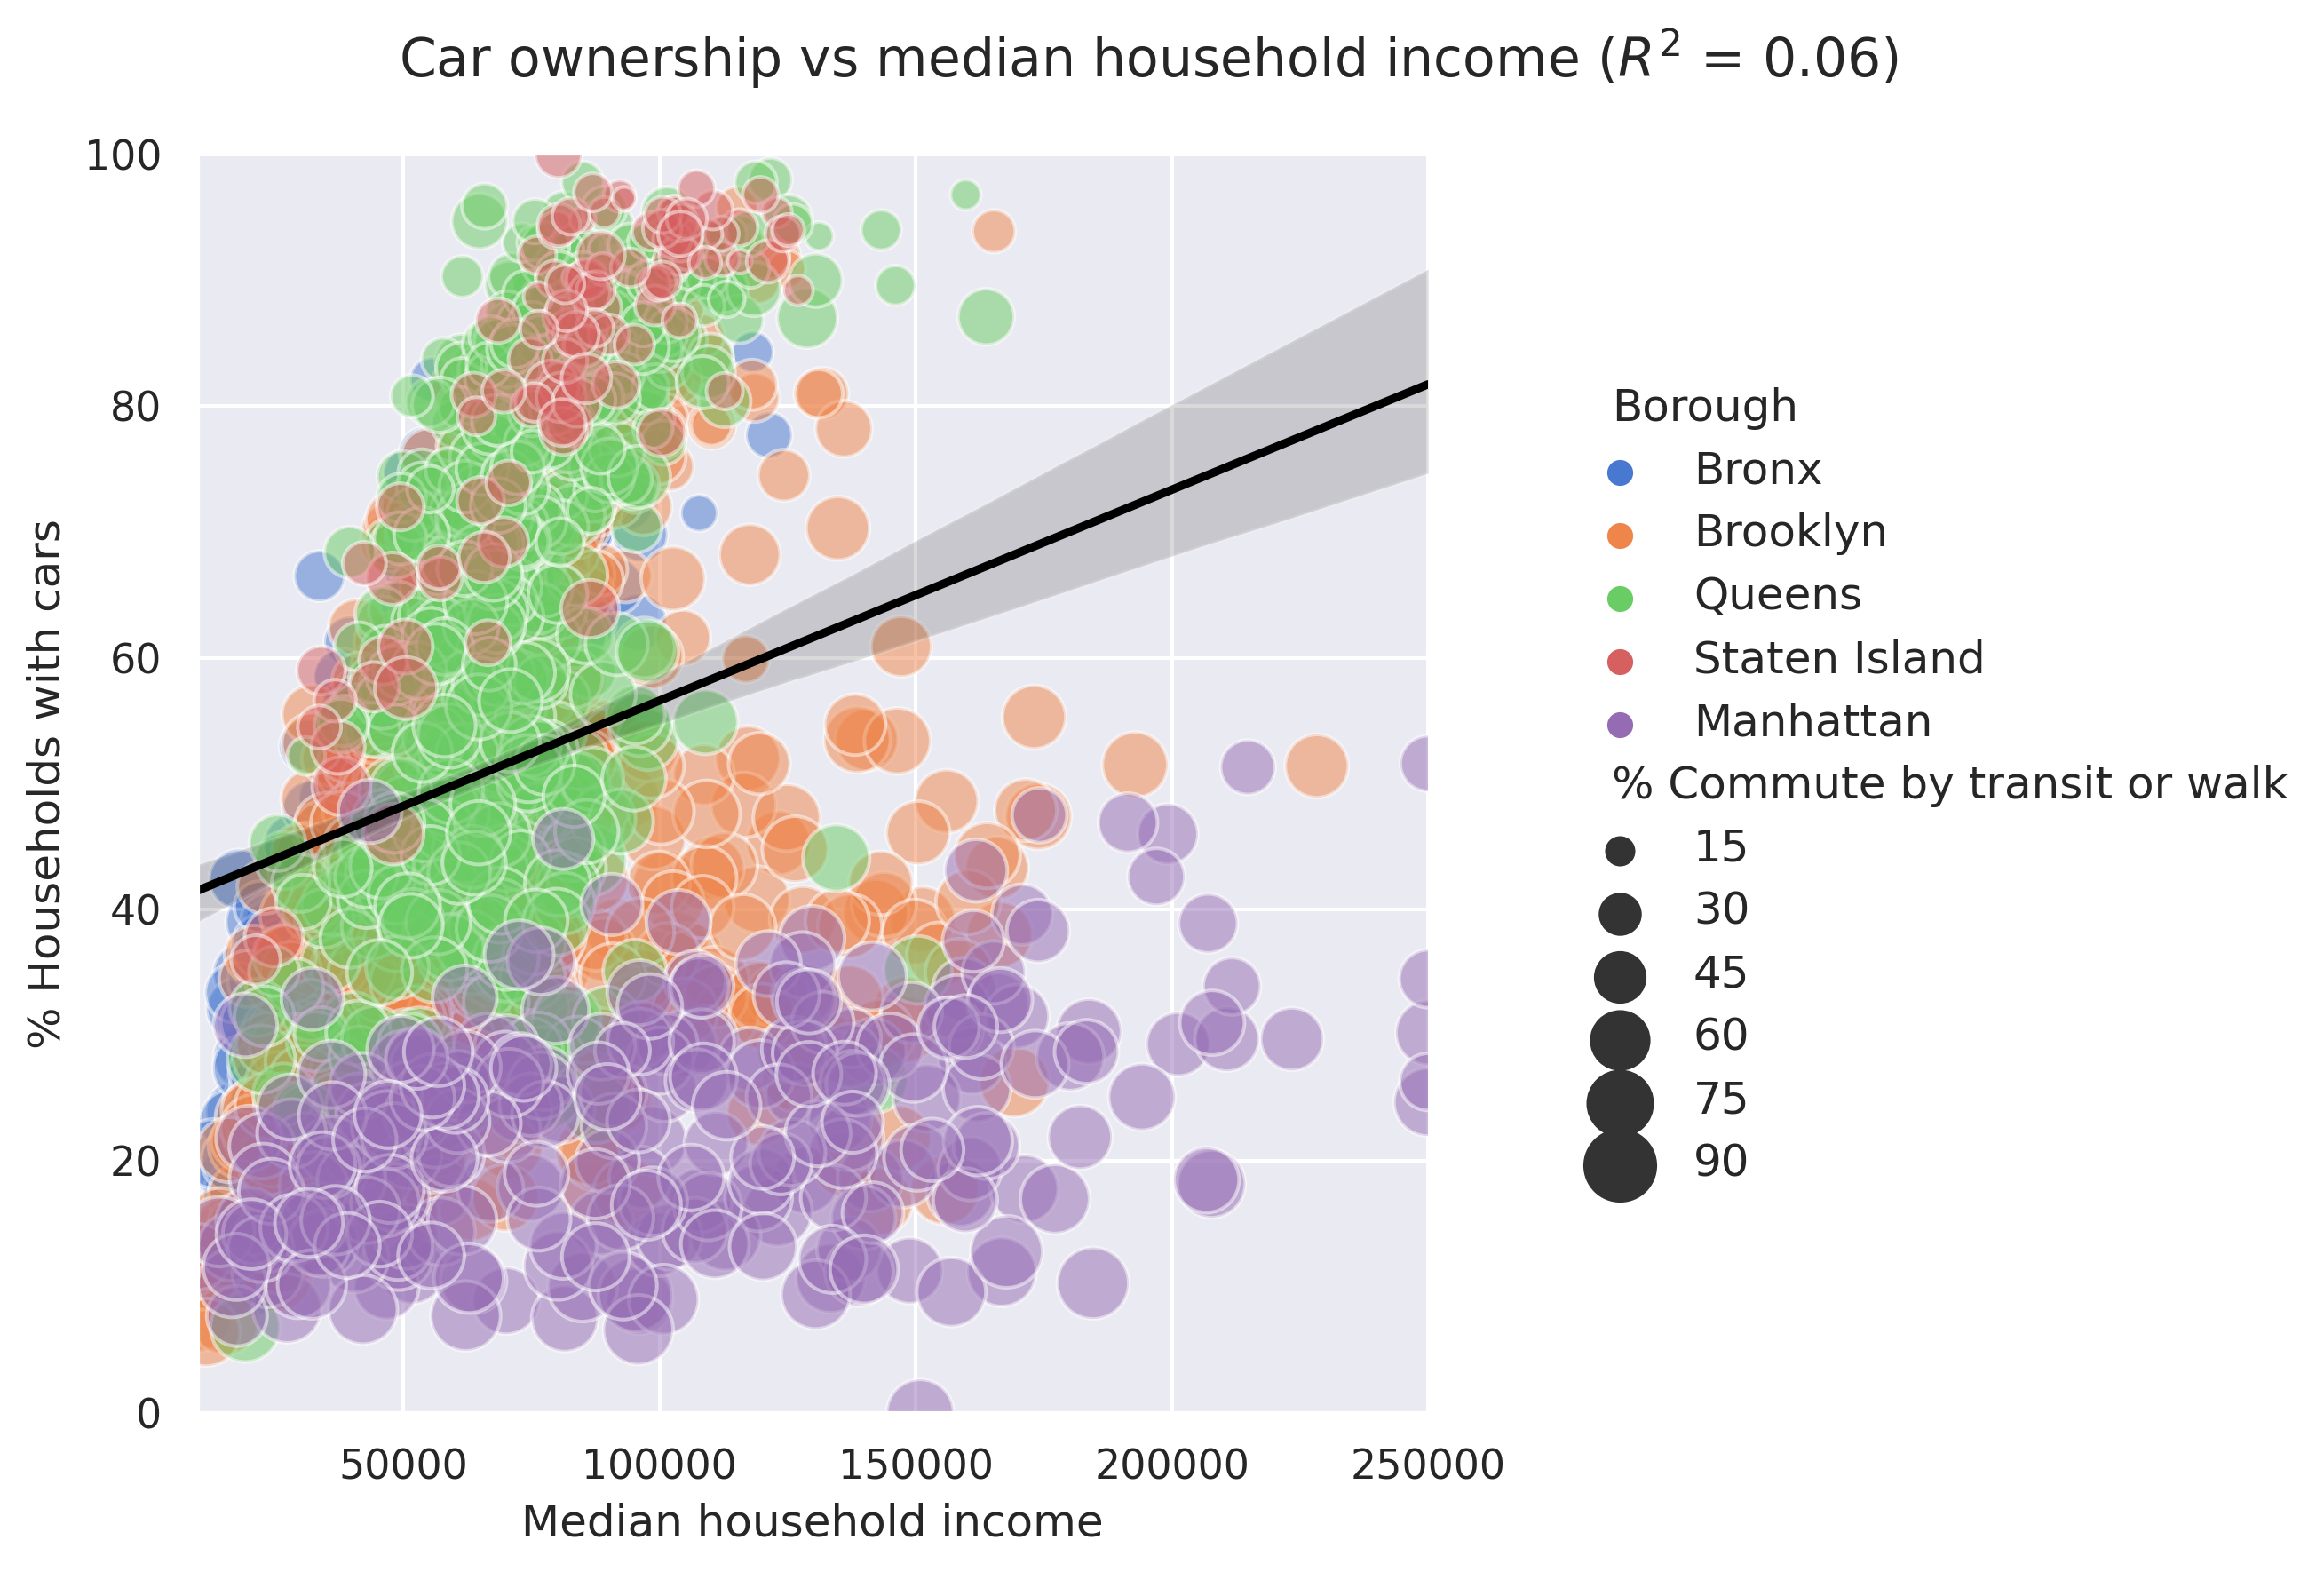
Intrigued by the modest negative correlation of the poverty rate with car ownership in a neighborhood but the near lack of correlation between the median household income and car ownership rate, I decided to investigate it further. The scatter plot of median household income vs car ownership rate offers some clues: high-income neighborhoods, especially in Manhattan and Brooklyn, have a lower rate of car ownership than the linear regressor would predict. This appears to be because a large fraction of the people in those neighborhoods commute by transit or walk. The correlation between median household income and car ownership jumps up to 0.31 when all Manhattan neighborhoods are removed.
Next, I estimate the average household income for car-owning households and non-car-owning households separately using ACS Public Use Microdata Sample files. Public Use Microdata Sample can be used to estimate variables (e.g. household income) on statistical geographic areas called Public Use Microdata Areas (PUMAs) conditioned on other variables (e.g. car ownership). PUMAs are larger than zip codes and are made of Census tracts – New York City is divided into 55 PUMAs.
In every PUMA, the average car-owning household has a significantly higher income than the average non-car-owning household. This ranges from 35% higher (Sunnyside) to almost 200% higher (Stapleton) with the median being 98% higher.
Thus a clearer picture emerges: affluent households are in transit-rich neighborhoods, typically in Manhattan and Brooklyn, and thus have a lower share of car ownership than would be predicted by income alone. But, on average, car-owning households are richer than non-car-owning households in every neighborhood.
A brief aside on congestion pricing: New York is in the process of implementing congestion pricing for vehicles entering Manhattan below 59th street. Aside from the core goal of reducing congestion and nudging people towards public transit, there are also other good reasons for it such as building dedicated lanes for buses that could speed up transit. A common refrain among opponents is that it is a regressive tax, while this has been debunked multiple times, I hope this analysis offers another data point in showing that congestion pricing is not a regressive tax on the least-affluent.
All these analyses are from data collected between 2014-2019, and therefore do not capture the effect of the COVID-19 pandemic, which did affect life in more than a few ways.
Did the pandemic change everything?
First, some historical context using data going back to 2007, the earliest year for which data exists. Between 2007 and 2019, the number of households in the city increased by 6%, and the number of workers living and commuting in the city increased by 9.5%. At the same time, the fraction of households without a car and the share of workers commuting by car both dropped by 1%.
In New York City, as in the rest of the country, transit use (particularly the subway) plummeted during the pandemic and more people might have bought cars than usual. At the same time, the pandemic also led to a bike boom with the number of bike trips hitting all-time highs week after week. There has also been a move towards opening up streets for people and converting some to parks. With the pandemic now receding (famous last words), subway ridership is on the rise and the number of bike trips shows no sign of slowing, including on weekdays.
Does this mean the increase in cars will be transitory? As the quote often attributed to Neils Bohr goes, “predictions are hazardous, especially about the future.” I’m not going to make a prediction but instead will emphasize that the future can be shaped by policy choices.
What does all of this imply?
Most New Yorkers do not own a car, much less drive to work. It might be tempting to think of the outer boroughs as all transit deserts, and ergo all its residents as owning and commuting by cars, but the reality is far from it.
Policies such as building full-time dedicated bus lanes, protected bike lanes, implementing congestion pricing to increase transit frequency would help the vast majority of New York City residents and most certainly the least affluent. The New Yorkers living in Melrose, Borough Park, East Harlem, Flushing, and Stapleton are testament to this.